Coffee Statistics
/ Control Group (Technology Company) 2015 Intern / Solo Work
Topic : Live data visualization / Web Design / Web Development / HTML5. CSS3. PHP. Javascript. JQuery. API
Soohyun's Internship Project aimed to energize the office more lively. By creating live data visualization, employees tend to keep eye on the screens to check new updating information from the public screens at the office. It brings more opportunities and possibilities of communication between employees around the office. Additionally, when customers who visit to the office, Control Group, they can image how the office are actively communicating.
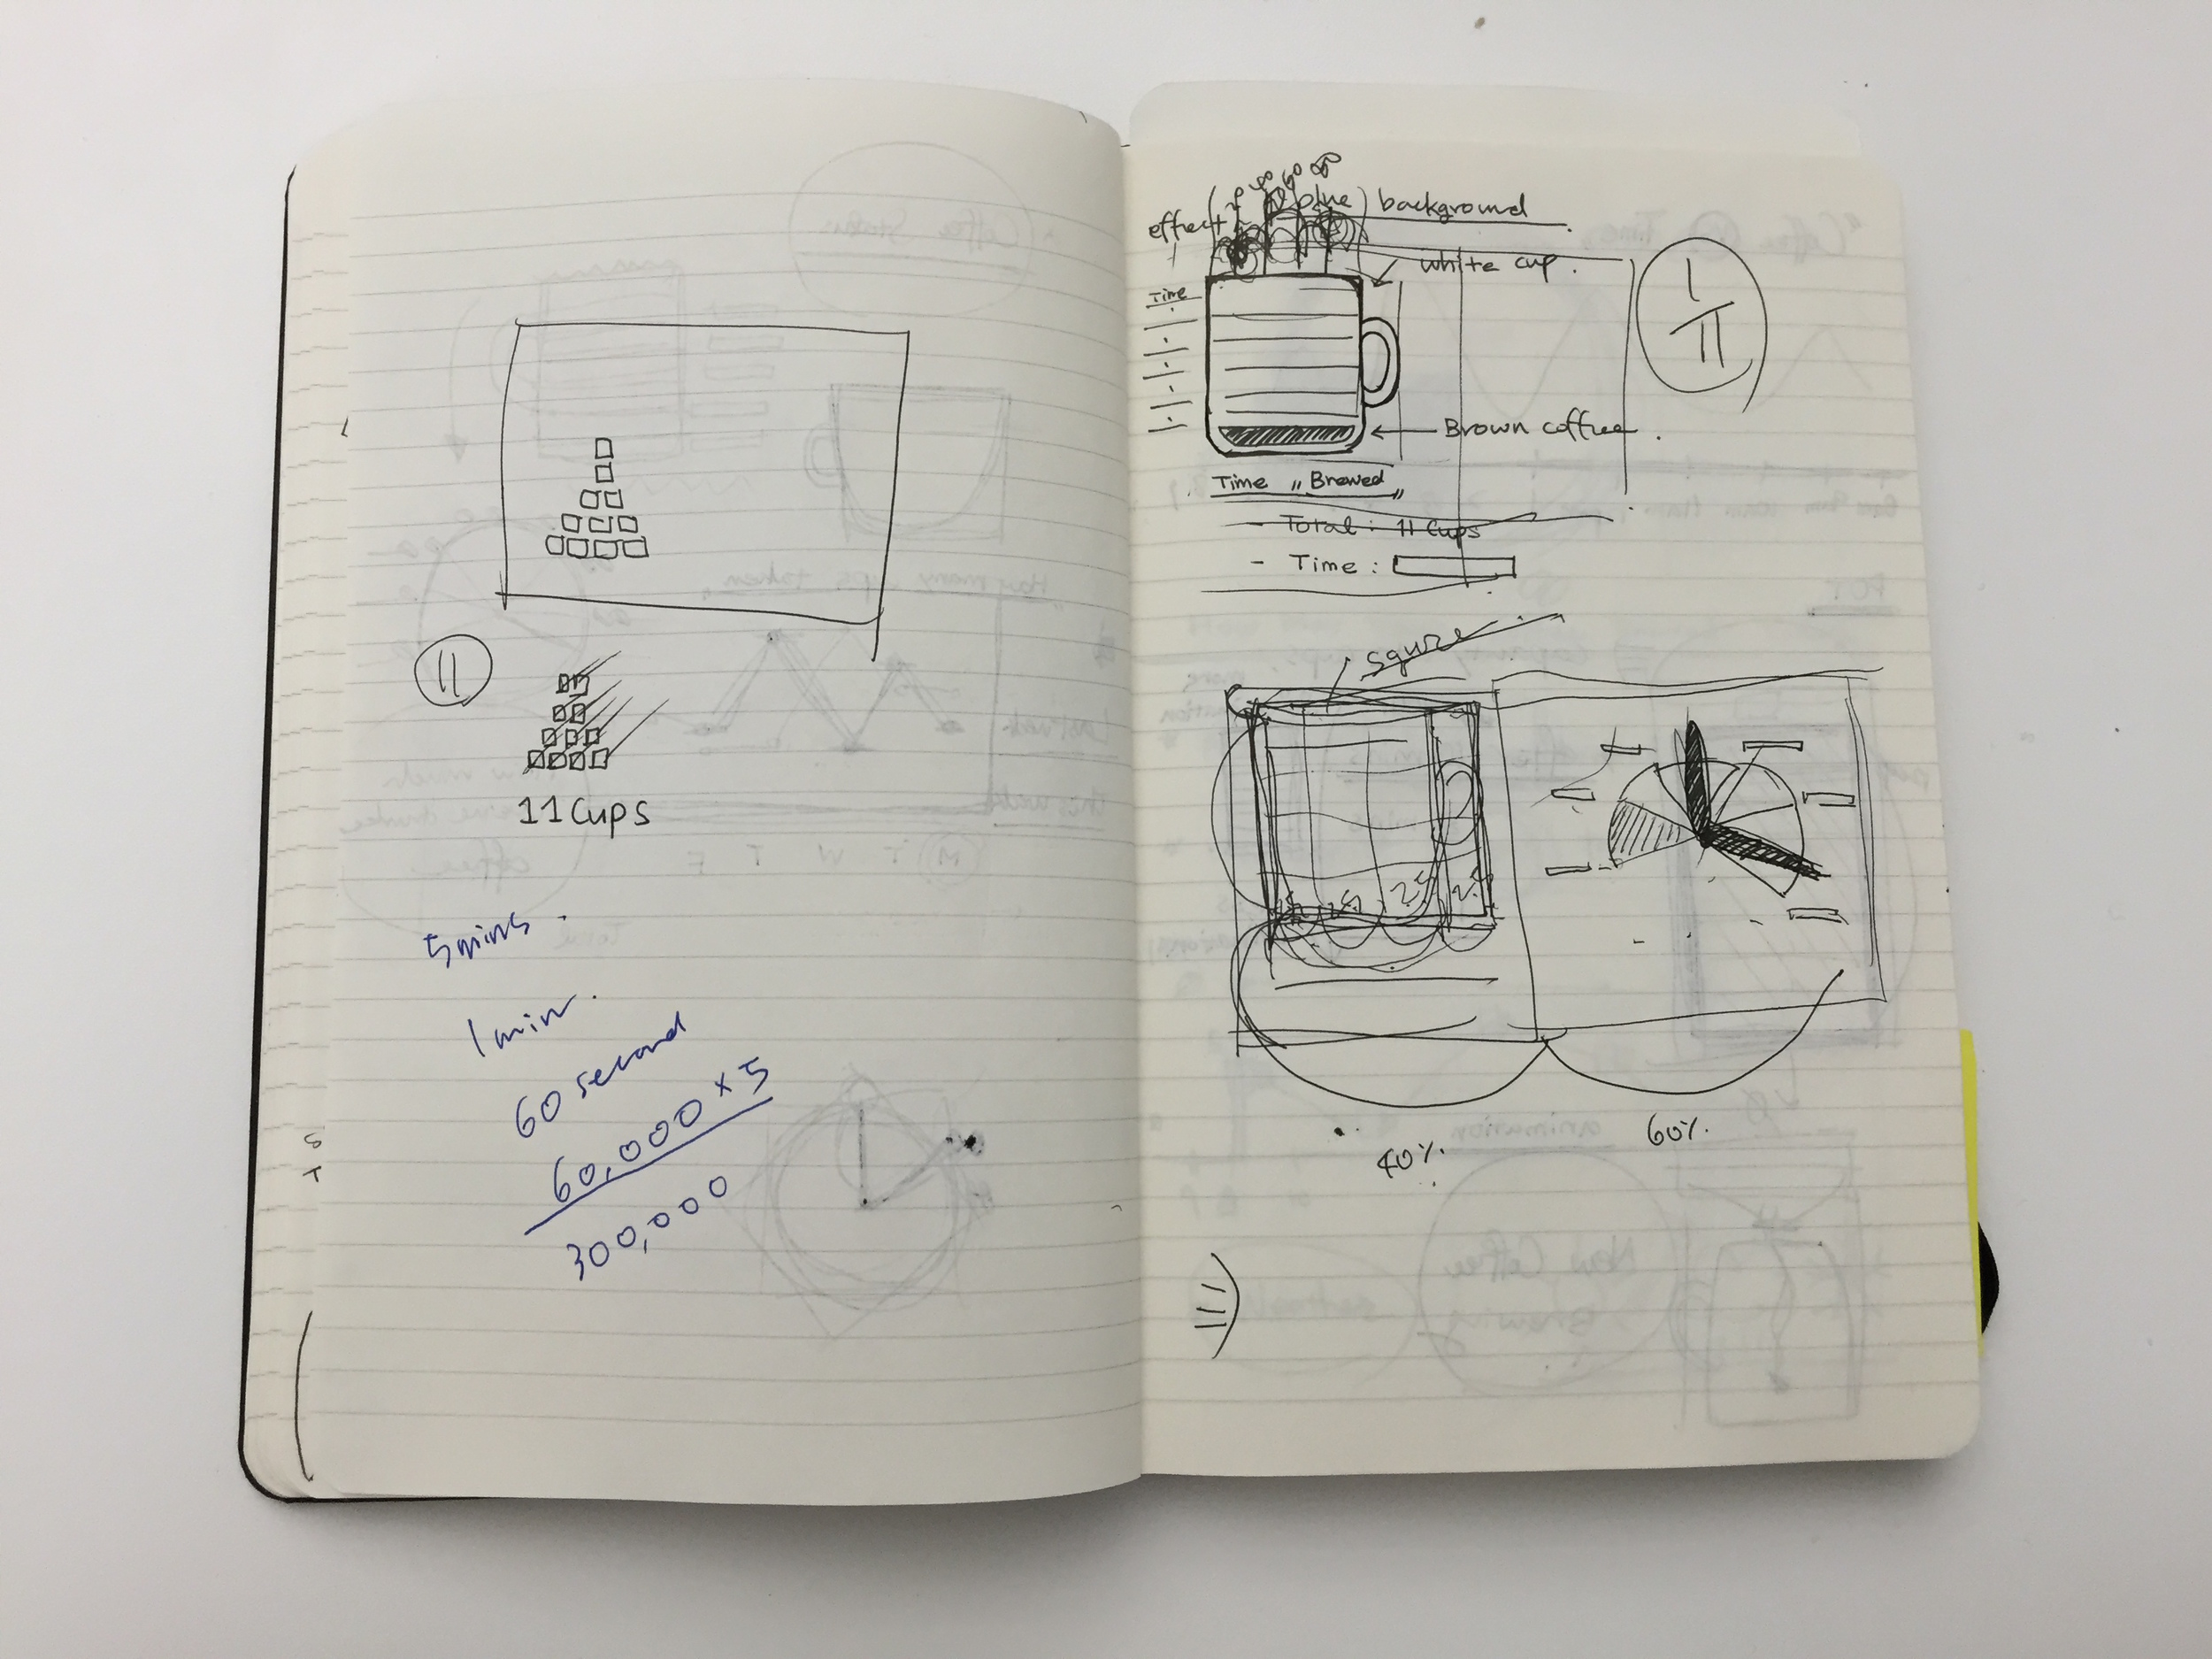
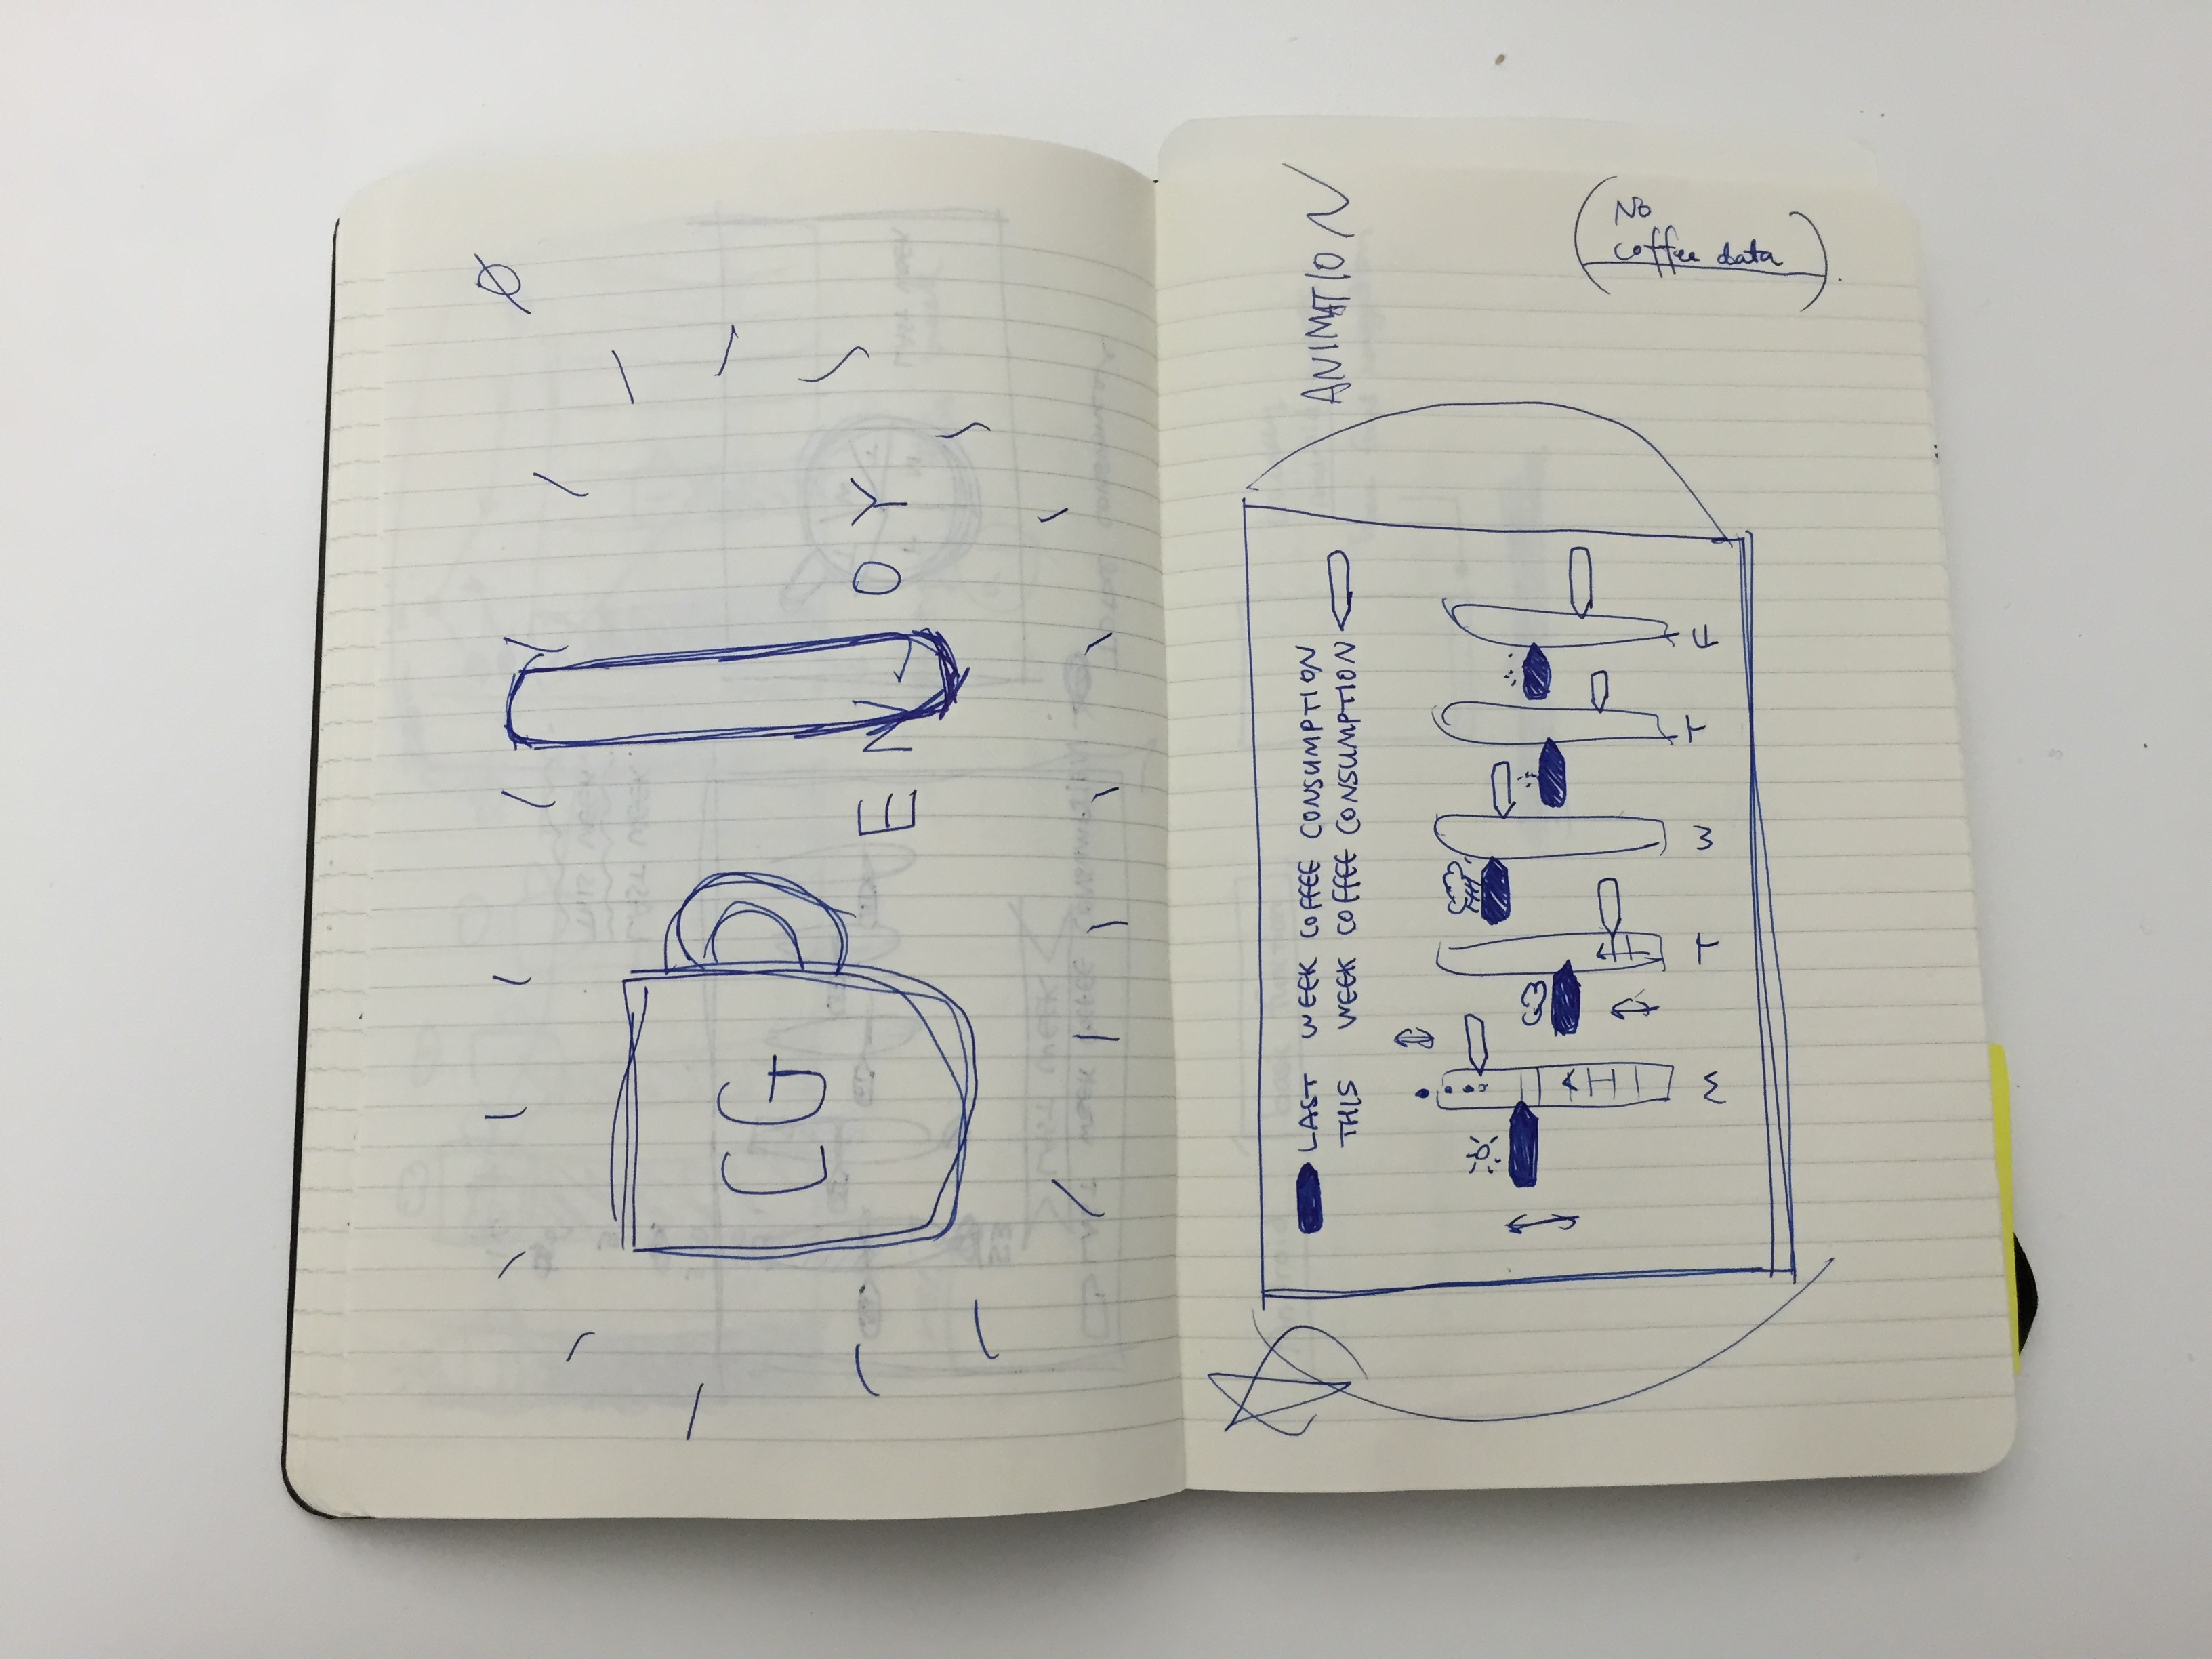
Sketch.
# Scene 1 : Intro - Control Group (Client) Logo
# Scene 2: Current pot and today's pots' data visualization.
# Scene 3: Current consumed coffee cups data visualization.
# Scene 4: Current number of consumed cups
# Scene 5: Weekly / Daily consumed coffee cups data visualization with weather info
# Scene 6: Ending Animation (Enjoy !)
- back to Scene 1
Design points.
** Focused on fun and delightful way of visualizing to energize the office.
** Focused on delivering complex data to simple and minimalistic design
** Natural and playful transition style
Check code (github) : https://github.com/soohyun-christine-park/coffee-statistics.git